Supply Chain Interactions,
Profitable Strategies Using n-Tier Relationships
By Alan Gigi and Martin Geissmann | October 1, 2020
Are we truly aware of how interconnected the global economy is?
Can we comprehend the intricacies of n-Tier supply chain interactions?
How can we glean Alpha using global supply chain insights?
Table of Contents
Introduction
When applying conventional trading strategies to timely structured supply chain data, further explained in this article, our research indicates that there is ample opportunity to generate positive alpha up to the range of 6.7%.
Imagine a scenario where an ongoing pandemic hits the developed world causing immediate disruptions to supply chains and global travel. How would that impact Boeing, an important supplier to American Airlines? How would that impact Kaiser Aluminium, an important supplier to Boeing? First degree relations of suppliers and customers are well documented and aware for most analysts, however using the highly advanced Inferess dataset the deeper relationships, the second or third degree, can be modeled and investigated to generate positive alpha.
A simplified view of the American Airlines' n-Tier supply chain

What is Low-Latency and Complete Supply Chain Data?
Supply chain data consists of a comprehensive mapping of a company with respect to its customers, suppliers and the global economy. Whilst the first and in some cases second tier of these relationships are evident through regulatory filings, uncovering the deeper network and the nth tier of a supply chain is an arduous task.
Previously, the extraction of this data required the manual review and compilation of filing documents, which is often prone to errors and neglect. However, with the embracement and growth of machine learning techniques in the industry it is now possible to generate an exhaustive database of companies and their supply chains with minimal delay after publication, and connect the missing links.
This automation provides a higher degree of accuracy as well as timeliness to the dataset. The uniqueness of this approach has numerous practical applications, amongst them is making investment decisions more profitable.
With this data, users can accurately see the financial inflows and outflows within a company, as well as of the company’s suppliers and customers. Thereby granting them an accurate map of the inter-linked nature of global supply chains. Furthermore, the dataset can also provide clarity towards how important certain customers and suppliers are to a company. For example if a company has only a few customers, those customers would enjoy a greater degree of importance than a company which has many customers.
Access Now: Advanced Features of Global Supply Chain Data


Trading Strategies
It is well documented how in the current economy companies are increasingly becoming more interconnected, however to what extent?
The answers to this question can be easily answered by having access to a comprehensive supply chain dataset that can accurately map and showcase the importance individual customers and suppliers have on a company’s performance.
The apparent application of this data can be for portfolio managers and traders, who can benefit from processing and adopting trading strategies using this data.
We developed quintile portfolios and devised various trading strategies based on the supply chain network connections between companies.
Return Momentum Strategy
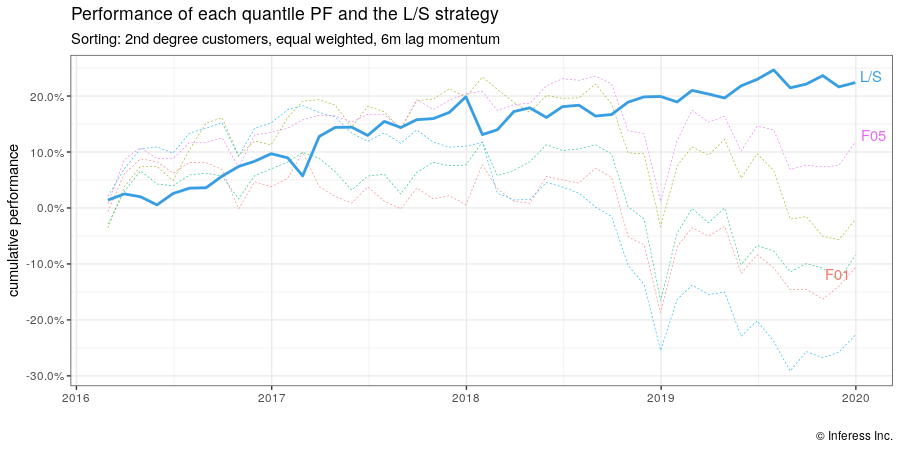
The stock performances of related companies to some extent can forecast the performance of a target companies stock.
Using the supply-chain data, we can isolate the performance of customers and suppliers past stock performances. This is because if a company’s customers are doing well then some degree of that positive performance should be translated up the supply chain. The same principle applies if a company’s suppliers are doing well, where the stock of a customer should rise only after the stock of a supplier rises.
In this strategy, the long-short portfolio is compiled by going long in the highest and short in the lowest position in the quintile portfolios. This strategy assumes that when a company reports lower revenue, this information will be immediately priced into the stock. However, there will be a time lag of sorts before the related companies can react accordingly. This assumption is crucial for this strategy because it seeks to capitalise on the time lag of the related companies using the momentum signals of the original company.
Learn more: Return Momentum Strategy


Fundamental Flow Factors Strategy
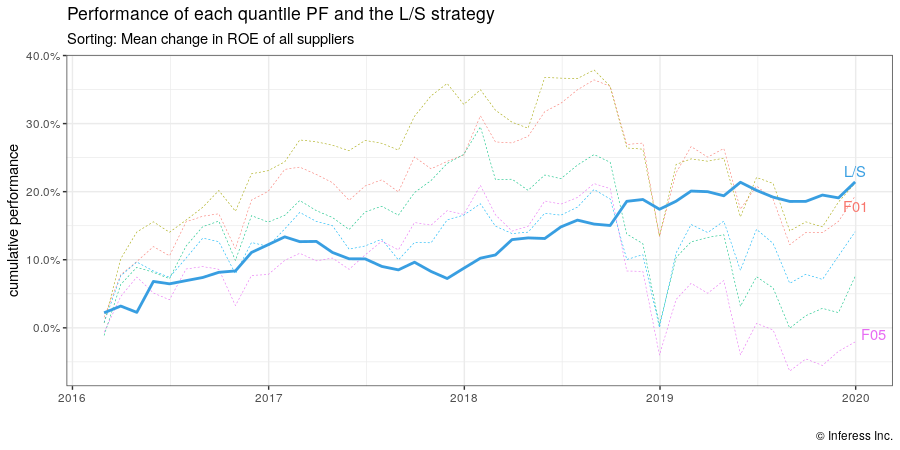
Fundamental flow factors strategy focuses on a companies' fundamental metrics. Factors computed from related companies’ fundamentals such as the return on equity (ROE), return on assets (ROA), or the earning yield are used to predict the performance of the target company’s stock performance.
Interestingly, performance is stronger in strategies based on signals from the suppliers ROE and earnings yield. This backs the intuition that if companies further up the supply chain are performing strongly, then the target company contributes to that strong performance by overpaying, hence it will perform worse than its peers. Furthermore, the Sharpe Ratio is higher on a supplier’s metrics than it is for a customer's metrics, even though the same long-short strategy yields positive returns on both.
Learn more: Fundamental Flow Factors Strategy
Link Interaction Factors Strategy
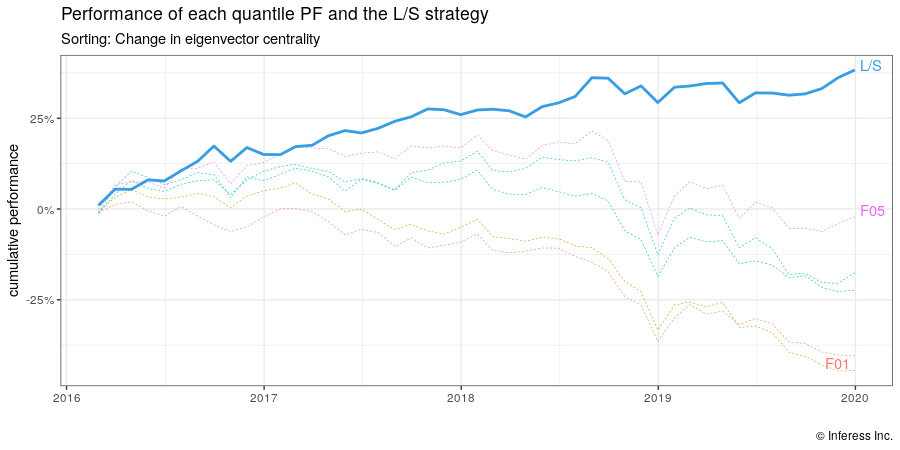
This strategy revolves around processing the complex network of customer-supplier and use network statistics to provide a systems view of a company’s importance within the overall economy.
Expectedly, the results indicate a positive return if the company reported additional outward degrees i.e. by acquiring new customers. Furthermore, increases in the number of inward, outward and total degrees of unlisted companies also produce positive returns. Finally, after computing centrality scores we found that companies with higher centrality scores outperform. Indicating that more interconnected companies on average perform better.
Learn more: Link Interaction Factors Strategy

